
Claude and Codex compiled a university ranking by Verilog and FPGA courses: what's inside
On October 30, 2026, a breakdown was published on Habr: two models in two days compiled a ranking of a hundred universities of the former USSR and California by 49 criteria from the world of Verilog, FPGA, and ASIC. We examine the mechanics: what was counted, where the data came from, and why the ranking cannot be read as a comparison of universities with each other.
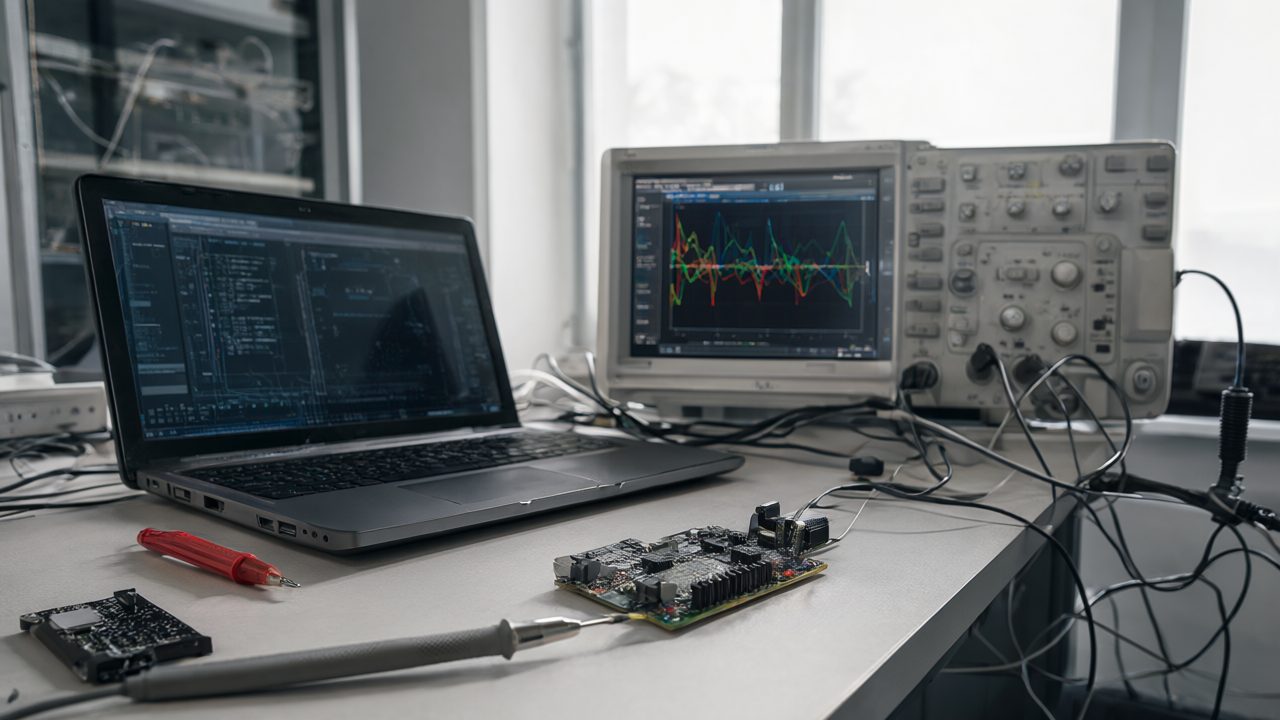
On October 30, 2026, Habr published a piece in which two language models — Claude Opus 5.5 and Codex Astra 6 — compiled a ranking of universities of the former USSR and California by 49 criteria in the field of Verilog, FPGA, and ASIC. The author set the list of items himself and asked for one point to be awarded for each. The work took two days; on the third day the models produced two reports.
A slide about a processor is not yet a course
The starting point is MIT course 6.111: labs on Verilog and FPGA plus the student's own project. Verilog is a hardware description language (HDL); it is used to write a circuit as text. FPGA is a field-programmable gate array, a chip that is configured for a task. ASIC is an application-specific integrated circuit, that is, a chip manufactured for a specific project.
Next, the author expanded the topic to 'not all Verilog courses are the same' and wrote out 49 items. The key rule: the models must not count a topic if it is only shown on slides. What counts is a lab where the student changes the pipeline (the chain of stages for processing instructions in a processor) — for example, adds bypasses (data bypass paths so as not to wait for a register write) to a static pipeline or reworks the back-end of a superscalar with out-of-order execution. And then runs the result in an RTL simulator (a simulator at the register-transfer level, not at the instruction level) or on an FPGA board.
This is a reasonable boundary. The difference between 'talked about the pipeline' and 'broke the pipeline and fixed it' is exactly the one visible in the repository.
Where the data came from
The models searched for course syllabi and student educational repositories, including on GitHub. The author frames this as 'rummaged through all the bins.'
Hence the main limitation: the ranking is built on public traces, not on a survey of departments. A course with closed repositories or without posted labs could simply have fallen outside the field of view. The procedure for verifying what was found is not described in the source text — there is no data.
A repository is generally weak evidence: it shows that a student submitted something, but it does not show how many hours this took, who checked it, or how it ended. As an indicator that 'there are labs here, not just lectures,' it works. As a measurement of teaching quality, it does not.
The ranking is unbalanced, and this is stated directly
The author himself writes: the sample is deliberately skewed toward California and the countries of the former USSR, and from the remaining countries the models were asked to choose 20 representative universities (the enumeration in the source text breaks off).
The practical conclusion is simple. The scores of a university from California and a university from a conditional third group cannot be compared: they have different conditions for entering the sample. Within one group, comparison is more meaningful, but even there the question of data completeness remains.
49 items with equal weight
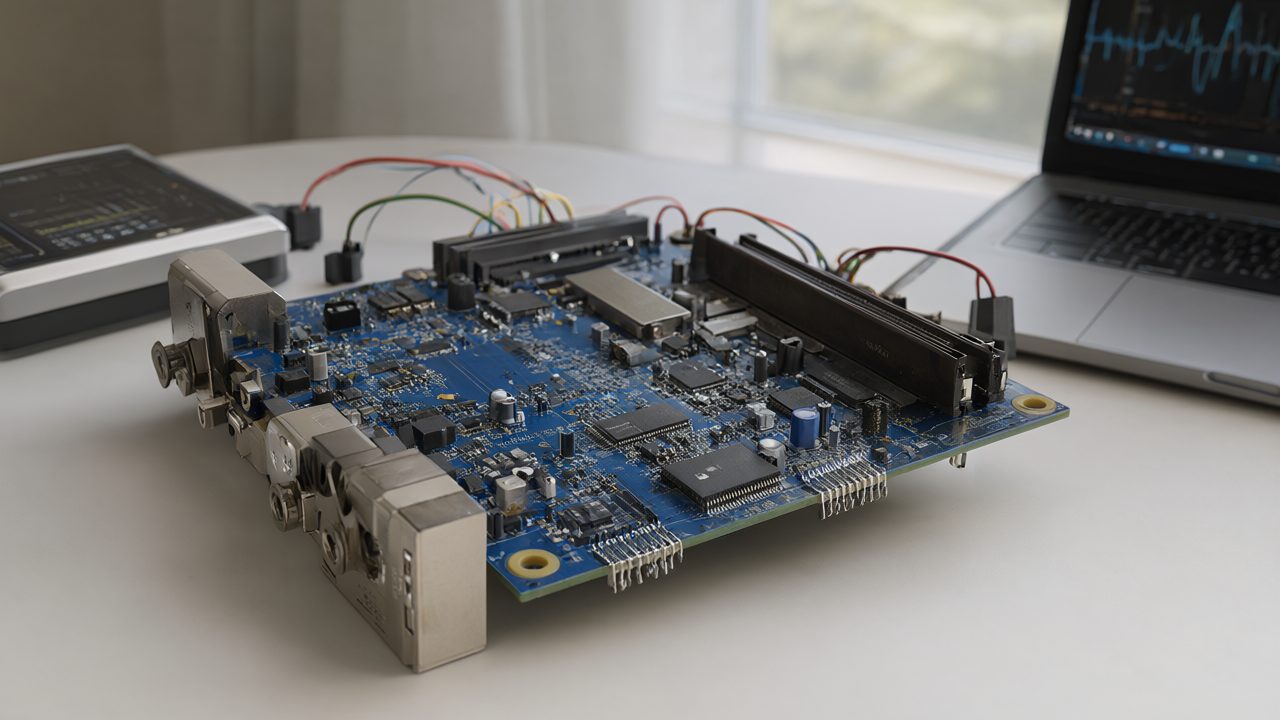
The author claims that some universities maintain a program based on IEEE recommendations from the mid-1990s, and that his list of 49 items is a more current set of requirements. Each item gives one point.
This means all criteria have the same weight. An item about a separate topic and an item about a full-fledged lab with modification of a superscalar are counted as equivalent. For a quick overview this is fine; for subtle conclusions it is not. The 49 items themselves are not listed in the provided fragment, and the weights are not justified — there is no data.
A second point: a point is awarded for a formal attribute. The author closed one hole — he forbade counting slides — but did not close the question of how deeply the student understands the topic. This is not a complaint about a specific work, but a property of any checklist-based scoring.
What to do with this
- Read the result as a map of courses, not as a ranking of education quality. The ranking answers the question 'where are there FPGA labs,' but not the question 'where do they teach better.'
- Check a specific university by hand: open the curriculum and course repositories, look for assignments with an RTL simulator and a board, not the names of disciplines.
- Ask the department about the tooling: which simulator, which board, whether the student is allowed to modify the pipeline or only run a ready-made one.
- Do not compare universities from different sample groups — the sample is deliberately skewed, and the author pointed this out.
- If you build a similar list of criteria yourself, fix the weights and the verification procedure before launching the models. Otherwise you will get 49 equivalent checkmarks and two reports that there is nothing to verify them with.